Congratulations to Blanche ter Hofstede and Linghao Hu on the publication of their paper, “Comparison of phasor analysis and biexponential decay curve fitting of autofluorescence lifetime imaging data for machine learning prediction of cellular phenotypes” in Frontiers in Bioinformatics!
In this paper, we compared two different fluorescence lifetime imaging analysis techniques, phasor analysis and exponential decay fitting, for fluorescence lifetime image feature extraction prior to using the fluorescence lifetime features in machine learning models to predict cell phenotypes. We found a slight increase in the cell identification accuracy for machine learning models built from the exponential decay data as compared with models that use phasor analysis features.
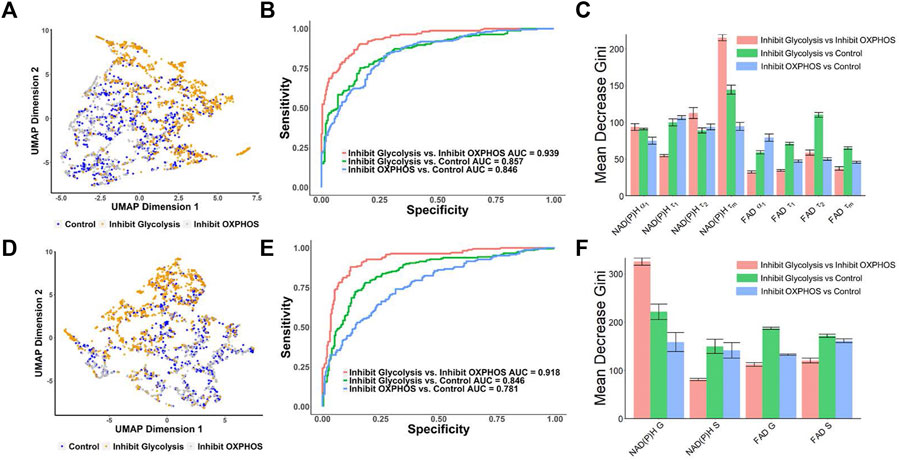
FIGURE 4. Prediction of the metabolic states of MCF7 cells from autofluorescence lifetime features [(A–C) use features from decay fitting, (D–F) use features from phasor plotting]. (A) UMAP of NAD(P)H and FAD autofluorescence lifetime features from decay fitting for control, 2DG and no glucose treatment (glycolysis inhibition) and cyanide groups (OXPHOS inhibition). Each dot corresponds to a single cell, blue corresponds to the control group, orange corresponds to the 2DG and no glucose treatment (glycolysis inhibition), and gray corresponds to the cells treated with cyanide (OXPHOS inhibition). (B) ROC curves of test data predicted from RFT machine-learning model using decay fitting features for the different metabolic states of the cancer cells. (C) Feature importance (mean decrease gini) of curve-fitting features within RFT classifiers for predicting metabolic states of cancer cells. (D) UMAP of NAD(P)H and FAD autofluorescence S and G phasor components for classification of different metabolic states of cancer cells. Each dot corresponds to a single cell, blue corresponds to the control group, orange corresponds to the 2DG and no glucose treatment (glycolysis inhibition), and gray corresponds to the group treated with cyanide (OXPHOS inhibition). (E) ROC curves of test data predicted from RFT machine-learning model using phasor analysis features for the different metabolic states of the cancer cells. (F) Feature importance (mean decrease gini) of phasor plot features within different RFT classifiers for predicting metabolic states of cancer cells.