We have a new publication (https://doi.org/10.3389/fbioe.2023.1293268) on our work related to autofluorescence lifetime microscopy for imaging cellular metabolism. In this paper, we define NAD(P)H and FAD fluorescence lifetime changes with perturbations to inhibit or enhance the metabolic pathways of glycolysis, oxidative phosphorylation, and glutaminolysis. Additionally, we develop and test conventional feature-based machine learning models to predict the metabolic phenotypes of cells from autofluorescence lifetime image data. We show that the models trained on human breast cancer cells successfully transfer to datasets of human T cells and murine liver cancer cells. This project was led by recent TAMU BME PhD graduate Linghao Hu with assistance from PhD student Nianchao Wang and our collaborators, Joshua Bryant, Lin Liu, Linglin Xie, and Phillip West.
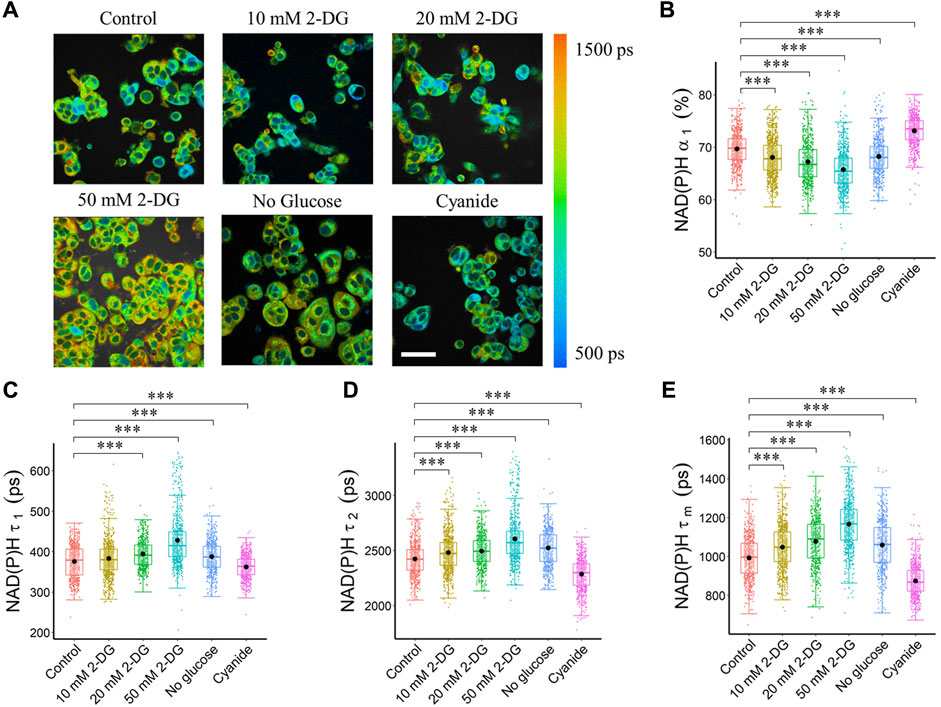
FIGURE 1. Glycolysis and OXPHOS inhibition alter the NAD(P)H fluorescence lifetimes of MCF7 cells. Glycolysis inhibition increased NAD(P)H fluorescence lifetime (τ1, τ2, τm), and reduced free NAD(P)H fraction (α1), while OXPHOS inhibition reduced NAD(P)H fluorescence lifetime (τ1, τ2, τm), and increased free NAD(P)H fraction (α1). (A) Representative NAD(P)H τm images, scale bar = 60 μm. (B) NAD(P)H α1 (C) NAD(P)H τ1 (D) NAD(P)H τ2 and (E) NAD(P)H τm. ***p < 0.001 for two-sided Wilcoxon test with Bonferroni correction for multiple comparisons. Substrates in each media: Control (25 mM glucose +1 mM pyruvate), 2-DG (25 mM glucose +1 mM pyruvate +10/20/50 mM 2-DG), No glucose (50 mM pyruvate), Cyanide (25 mM glucose +1 mM pyruvate +4 mM NaCN).
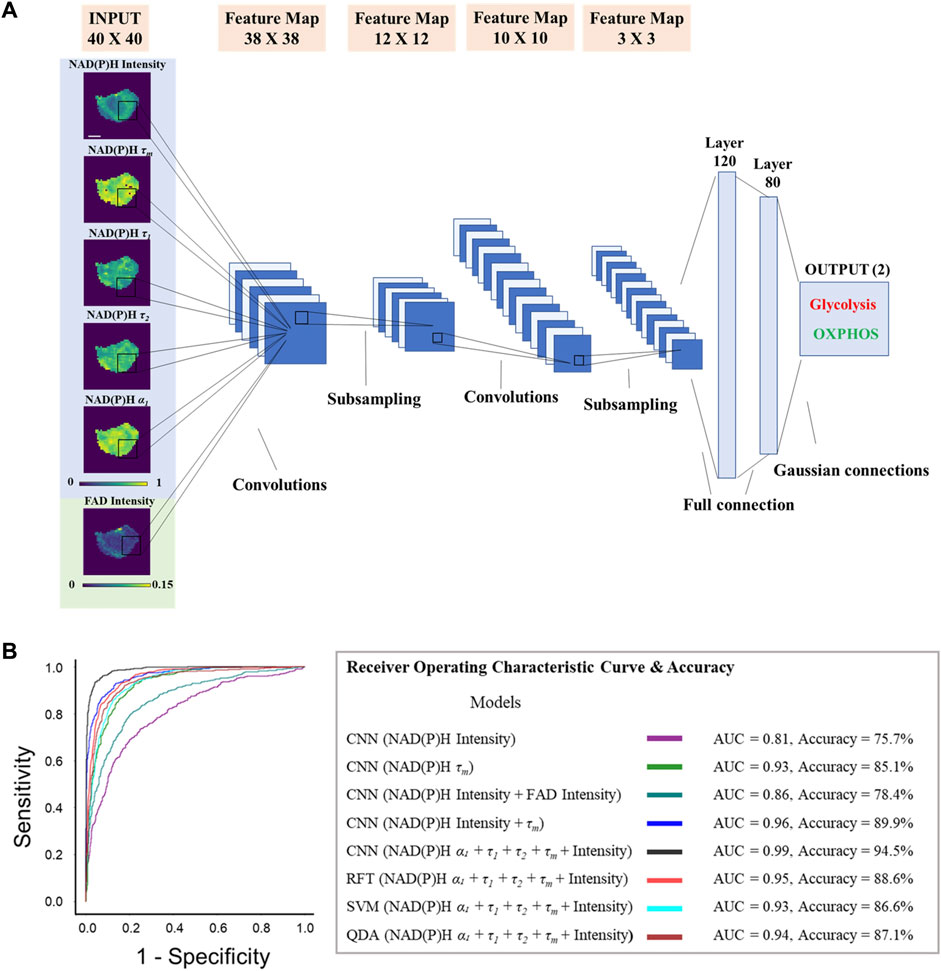
FIGURE 5. Metabolic activities of breast cancer cells are predicted from autofluorescence lifetime images. CNN models trained on autofluorescence lifetime images achieved approximately 95% accuracy in classifying glycolytic and oxidative cancer cells. (A) Predicting MCF7 metabolism as glycolysis inhibition or OXPHOS inhibition from autofluorescence lifetime images with CNN. The LeNet CNN models were trained with different fluorescence lifetime component images (NADH τ1, NADH τ2, NADH α1, NADH τm, NADH intensity, FAD intensity), scale bar = 7 μm. (B) AUC ROC curves and accuracy for the test dataset (n = 1,520) of each classifier built to predict metabolism as glycolysis inhibition or OXPHOS inhibition. RFT: random forest tree; SVM: support vector machine; QDA: quadratic discriminant analysis.